Energy-Dispersive Spectroscopy
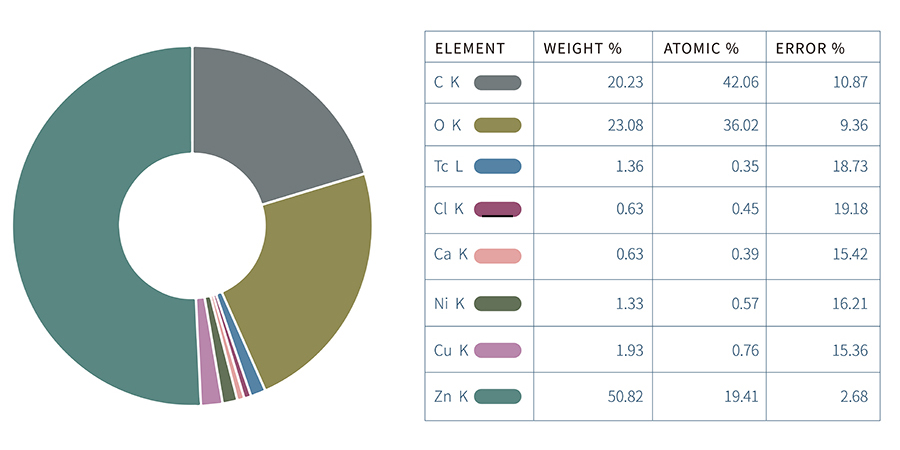
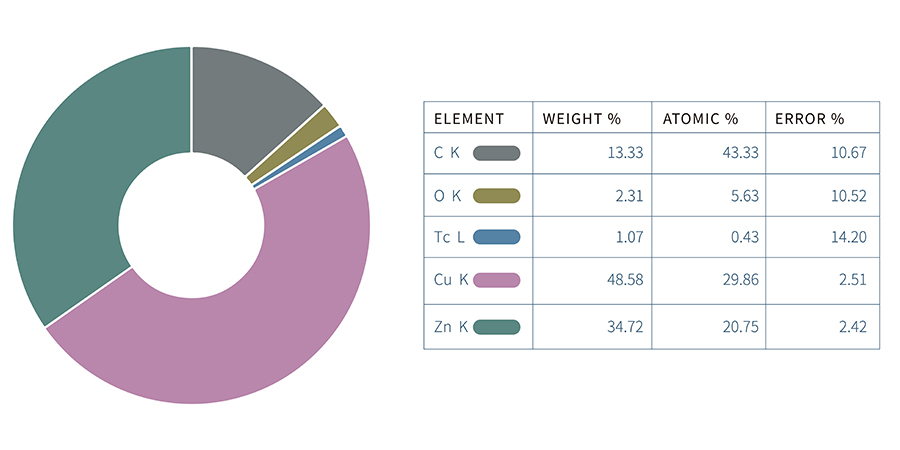
■Figure 4
EDS spectra of Brass samples (Top spectra: Pristine / Bottom spectra: Degraded).
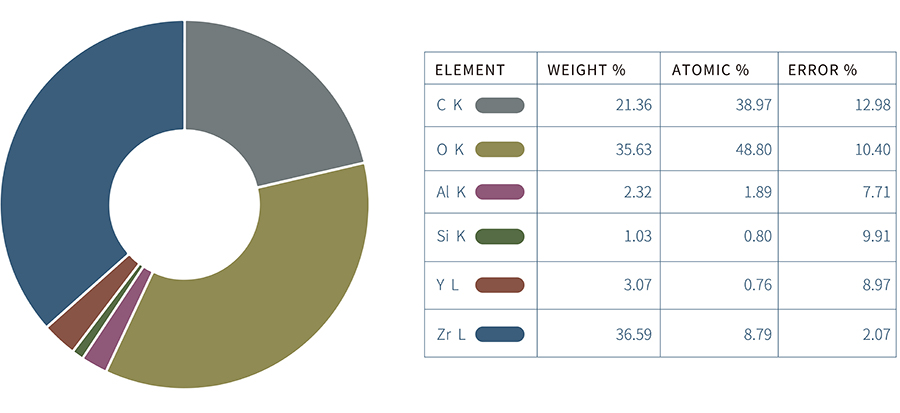
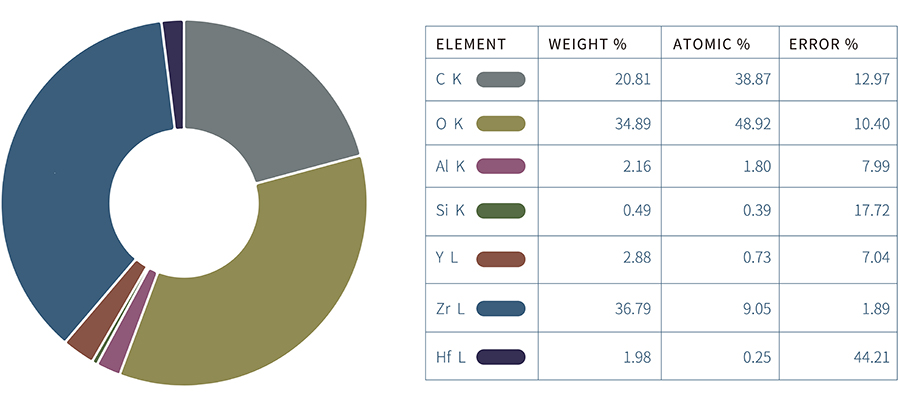
■Figure 5
EDS spectra of Zirconia samples (Top spectra: Pristine / Bottom spectra: Degraded).
EDS spectroscopy was another technique used to characterize the pristine and degraded samples. The elemental mapping of the samples remained consistent for the ceramic centerpost for both pristine and
degraded samples. Only a slight increase in oxidation of the sample was measured. The EDS spectra of the brass on the other hand (Figure. 5), shows a drastic change in percent oxygen in the sample due to the formation of the oxide layers. This indicates degradation of the brass sample that was held at 600 °C.